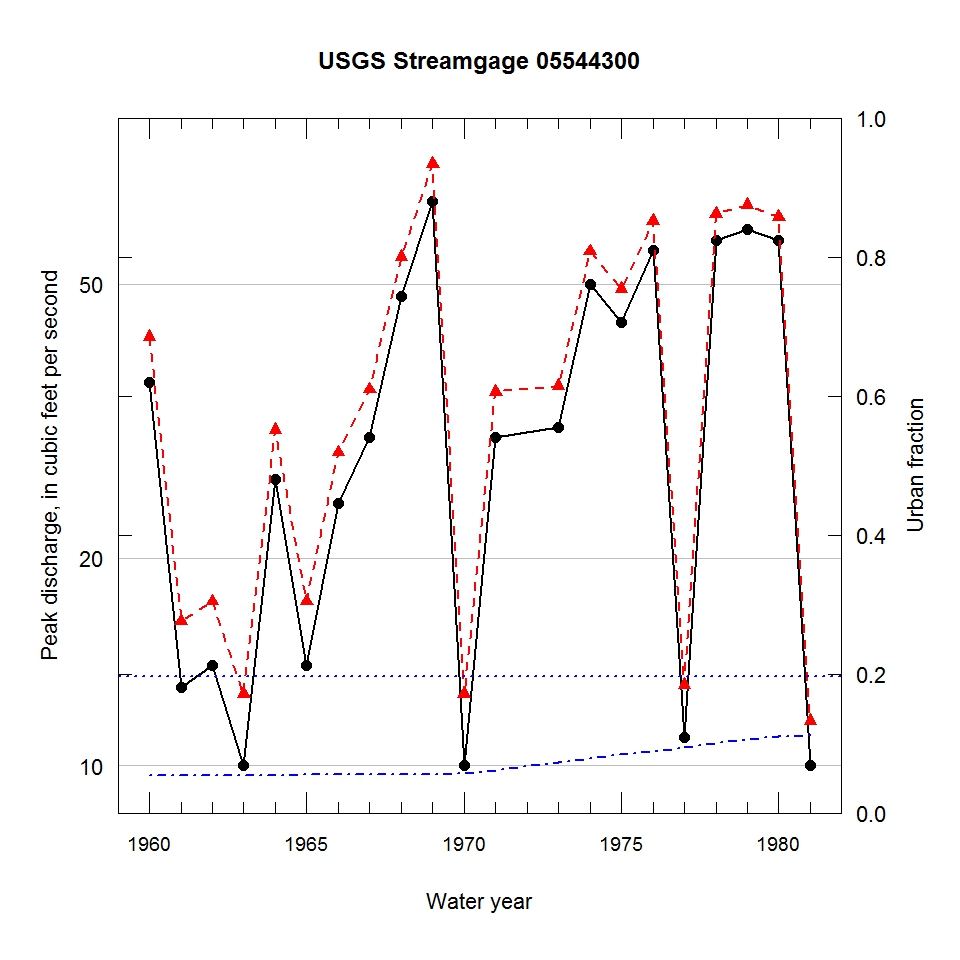
Observed and urbanization-adjusted annual maximum peak discharge and associated urban fraction and precipitation values at USGS streamgage:
05544300 MUKWONAGO RIVER TRIBUTARY NEAR MUKWONAGO, WI


| Water year | Segment | Discharge code | Cumulative reservoir storage (acre-feet) | Urban fraction | Precipitation (inches) | Observed peak discharge (ft3/s) | Adjusted peak discharge (ft3/s) | Exceedance probability |
| 1960 | 1 | -- | 0 | 0.053 | 0.991 | 36 | 42 | 0.390 |
| 1961 | 1 | -- | 0 | 0.054 | 0.392 | 13 | 16 | 0.894 |
| 1962 | 1 | -- | 0 | 0.054 | 0.084 | 14 | 17 | 0.879 |
| 1963 | 1 | 4B | 0 | 0.054 | 0.084 | 10 | 13 | 0.935 |
| 1964 | 1 | -- | 0 | 0.055 | 0.084 | 26 | 31 | 0.623 |
| 1965 | 1 | -- | 0 | 0.055 | 1.243 | 14 | 17 | 0.879 |
| 1966 | 1 | -- | 0 | 0.055 | 0.725 | 24 | 28 | 0.668 |
| 1967 | 1 | -- | 0 | 0.055 | 0.466 | 30 | 35 | 0.522 |
| 1968 | 1 | -- | 0 | 0.056 | 0.874 | 48 | 55 | 0.213 |
| 1969 | 1 | -- | 0 | 0.056 | 2.241 | 66 | 75 | 0.086 |
| 1970 | 1 | 4B | 0 | 0.056 | 0.084 | 10 | 13 | 0.935 |
| 1971 | 1 | -- | 0 | 0.062 | 0.868 | 30 | 35 | 0.528 |
| 1973 | 1 | -- | 0 | 0.073 | 3.035 | 31 | 36 | 0.512 |
| 1974 | 1 | -- | 0 | 0.078 | 0.622 | 50 | 56 | 0.201 |
| 1975 | 1 | -- | 0 | 0.084 | 0.358 | 44 | 49 | 0.283 |
| 1976 | 1 | -- | 0 | 0.089 | 1.751 | 56 | 62 | 0.158 |
| 1977 | 1 | -- | 0 | 0.095 | 1.816 | 11 | 13 | 0.932 |
| 1978 | 1 | -- | 0 | 0.100 | 1.188 | 58 | 63 | 0.148 |
| 1979 | 1 | -- | 0 | 0.105 | 0.330 | 60 | 65 | 0.136 |
| 1980 | 1 | -- | 0 | 0.111 | 0.949 | 58 | 63 | 0.152 |
| 1981 | 1 | -- | 0 | 0.112 | 1.621 | 10 | 12 | 0.946 |

